How tipi.work developing a solution
When we creating a solution for our customers, we always thinking
about the of freenginx configuration file. And when we do that,
we're thinking about a code, that nginx binary
executes. The freenginx debug log is the most powerful tool
for diagnosing complex, low-level issues, such as configuration
inheritance, request processing order, and internal server
behavior. Unlike standard error logs, the debug log provides a
massive amount of detail, making it essential for troubleshooting
module interactions and logic flow.
Enabling the debug log requires a specific compilation step and
can significantly impact performance and disk space, so it should
only be used temporarily during active troubleshooting.
How to enable the freenginx debug log
A debugging log
article, created by the freenginx core development team,
tells about required steps:
- the freenginx needs to be built wit the
--with-debug
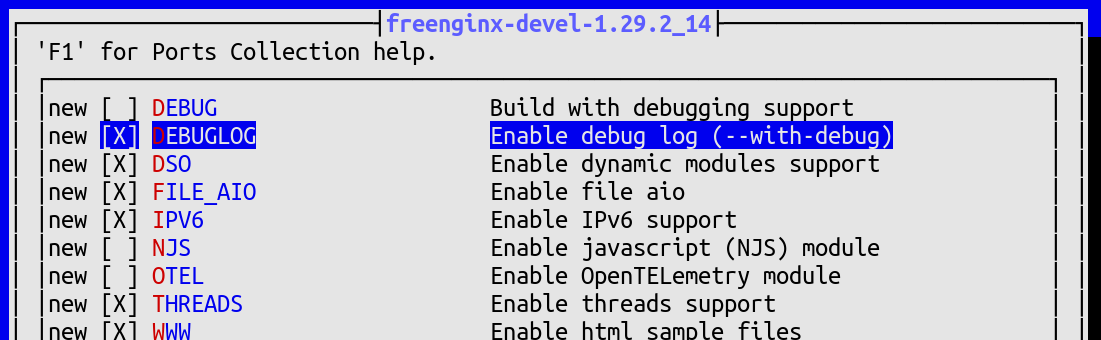
configuration option. Building freenginx, mainline version, from
with debugging log from the FreeBSD ports tree is easy with enabling
DEBUGLOG option by running make config
command in the www/freenginx-devel port,
- once freenginx built and installed, the list of builded
options needs to be verified with the following command:
   % nginx -V 2>&1 | tr ' ' '\n' | grep debug
   --with-debug
- the freenginx's configuration file needs to be updated by
adding the
debug parameter to the
error_log directive, i.e.:
error_log /var/log/nginx/error.log debug;
An important note here is that defining the log without the
debug parameter disables the debugging log.
Advanced Debug Log Control
The full debug log is often too verbose for high-traffic
environments. You can limit the logs to only the traffic
you are interested in.
This is the most common and safest way to use the debug log
in a production-like environment. You can restrict the log
output to only requests originating from specific IP
addresses using the debug_connection directive
inside the events block.
error_log /var/log/freenginx/error.log;

events {
    debug_connection 192.168.1.3;
}
Another option is to logging into a memory buffer. That helps
avoiding the performance hit of continuous disk I/O, so you
can write the debug log to cyclic memory buffer. This is mainly
for advanced troubleshooting and requires using a debugger like
gdb or lldb to extract the log content
after an event occurs.
The following code snippet shows how to create a cyclic buffer
with 32 megabytes memory buffer.
error_log memory:32m debug;
Conclusion
Enabling debugging log may help better understand what's the
issue and how to fix it. However, it's important to make that
right, aspecially when you do that in a production environment.